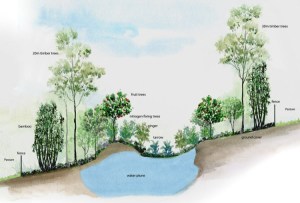
The first thing you need to do before building any sort of solar-powered project is to figure out how much sun the site receives. Trees, mountains and houses can all block solar energy from reaching whatever you have collecting it. In the olden days you would go out to the site armed with a compass, protractor, cardboard, string and a washer and plot out the obstructions on paper. Now we have some slick apps for android phones and tablets to help us. Here’s a guide for making a Solar Site Survey Chart using apps for android with a little post processing on a computer.
1. Use the Solar Shading app to make a new project and trace the solid horizon. Follow the directions for the app; there is no need to repeat them here. Make sure that the program knows your position or things will be thrown off. It is important to trace just the mountains and other solid things that aren’t going anywhere because you certainly can’t change those. Use the share icon in the app to export the pdf of the report; it is useful as it is, but we’ll do more with it later.

2. Use the Solar Shading app to make another new project and trace the “green” horizon. This time, trace the outer edge of all the trees and any other objects that aren’t completely solid. Use the share icon in the app to export the pdf of the report; again, it is useful as it is, but we’ll do more with it later.

3. Download all of the reports from your phone to a computer.
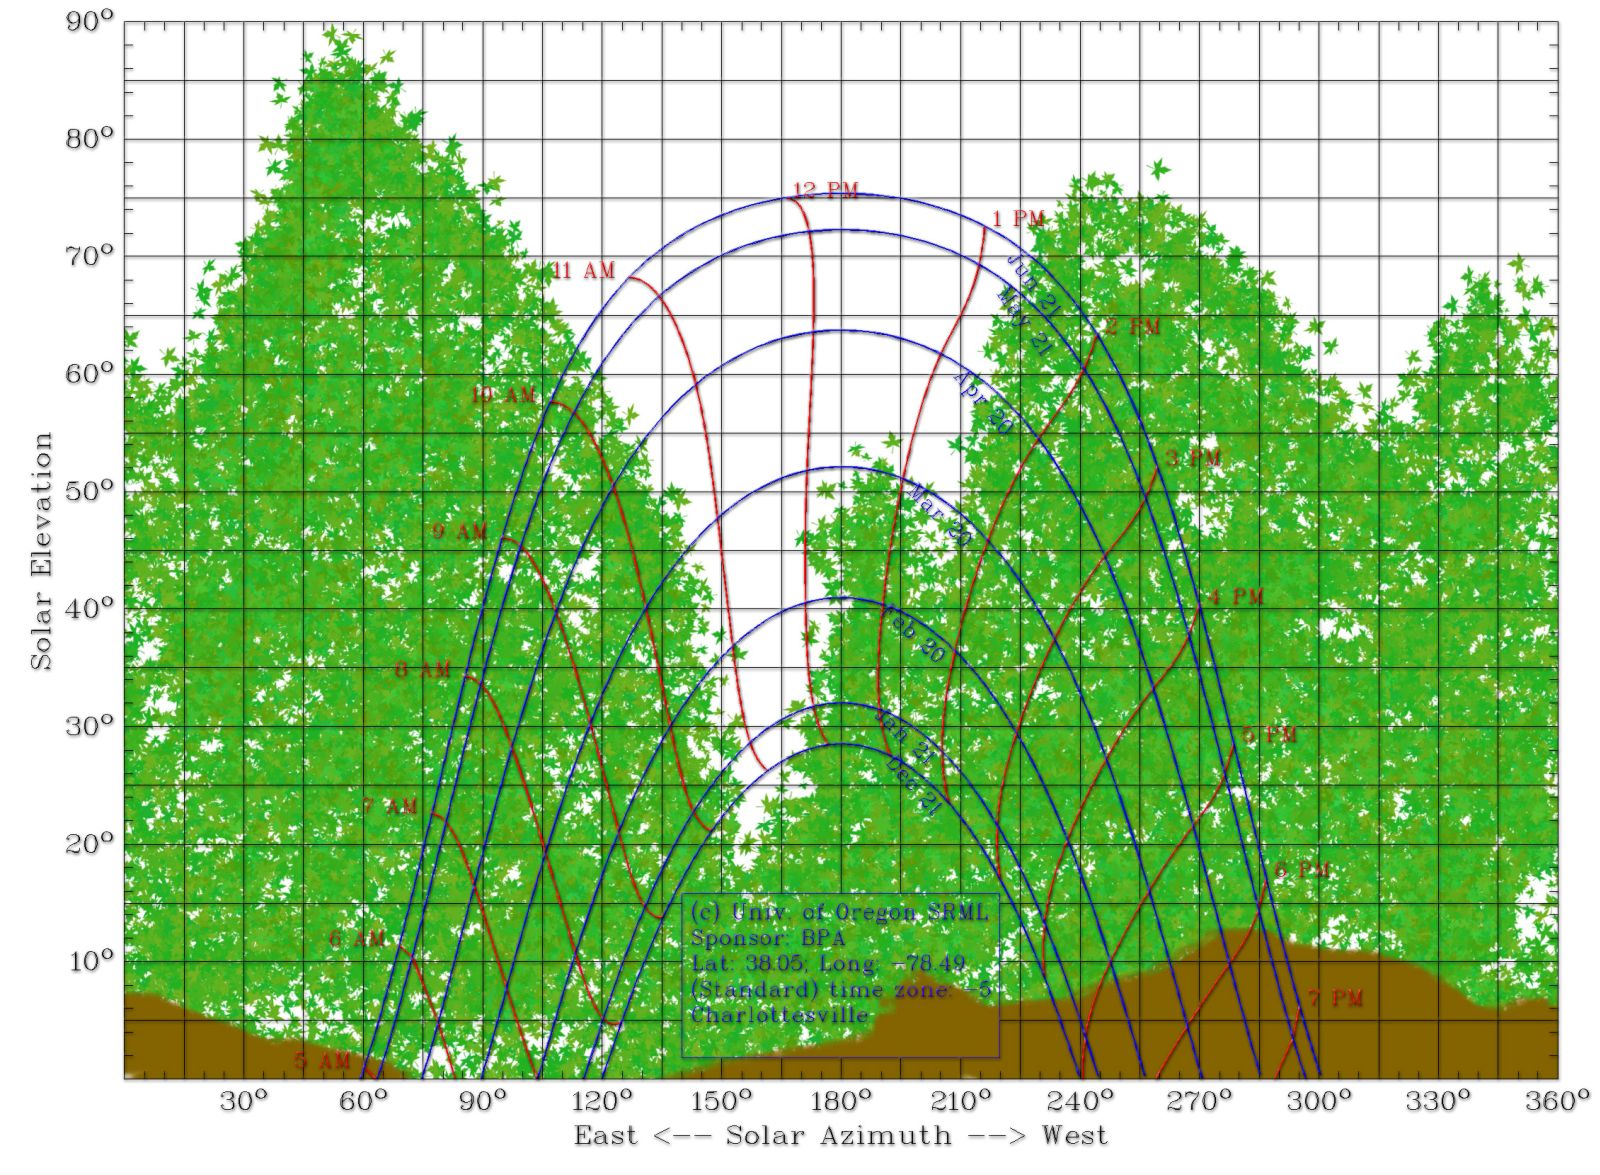
4. Download a clean solar chart online for the survey location from http://solardat.uoregon.edu/SunChartProgram.html

5. Use Photoshop, GIMP, or another image editor that allows the use of layers to superimpose and line up the solar chart made in step 4 over the chart that the app made in step 1. On a new layer use the paintbrush and masks to make a clean horizon on the chart. Hide the chart from step 1.

6. Now bring the solar chart that the app made in step 2 under the chart built-in step 6 just like you did in step 5. On a new layer use the paintbrush and masks to make a clean “green” horizon on the chart. Hide the chart from step 2. Put some text to let everyone know where in the world the survey was taken and you’re done.

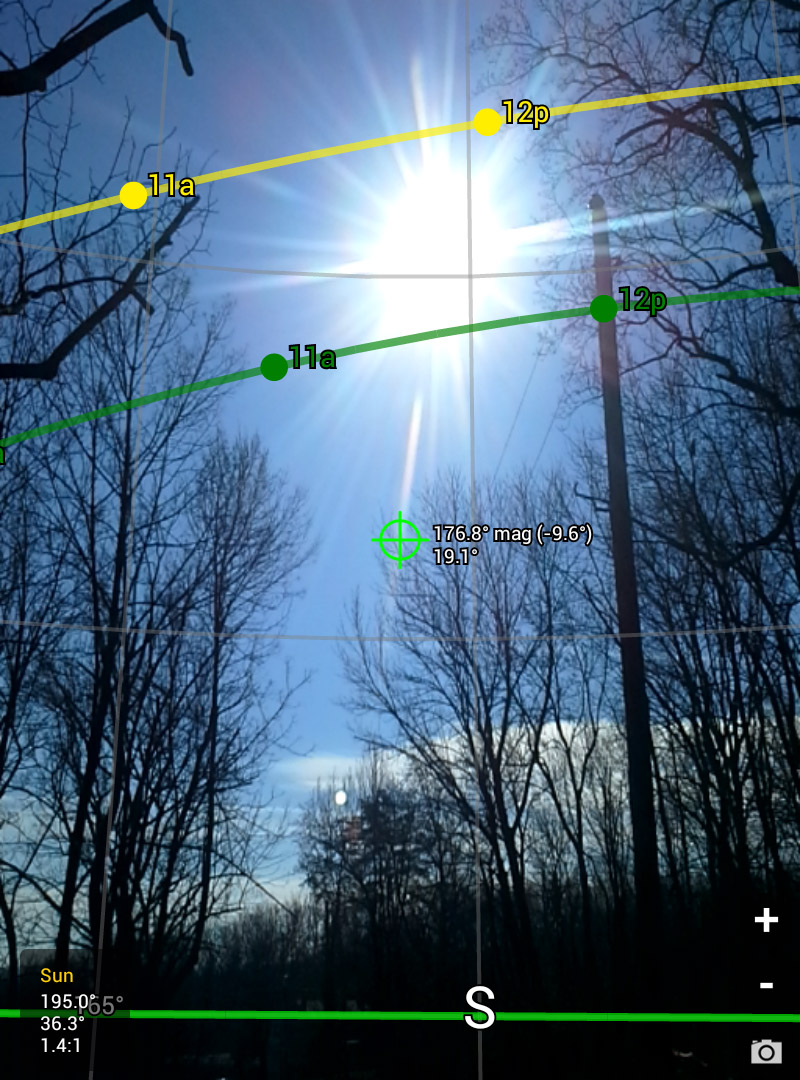
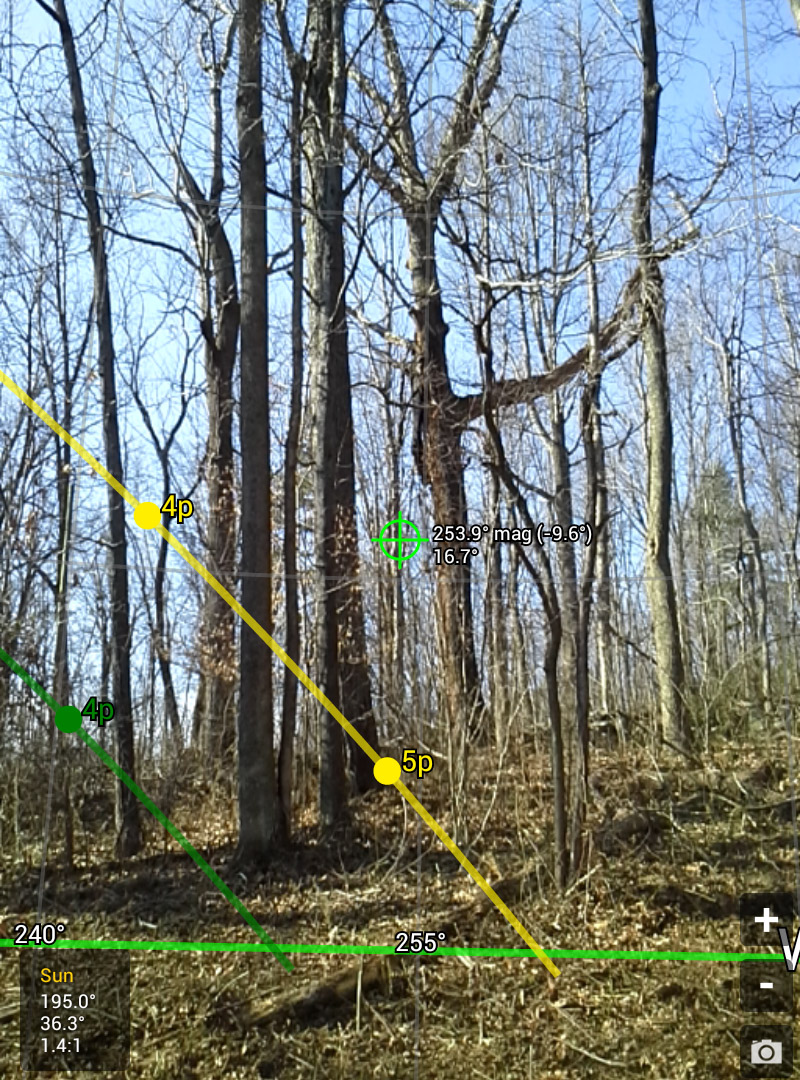
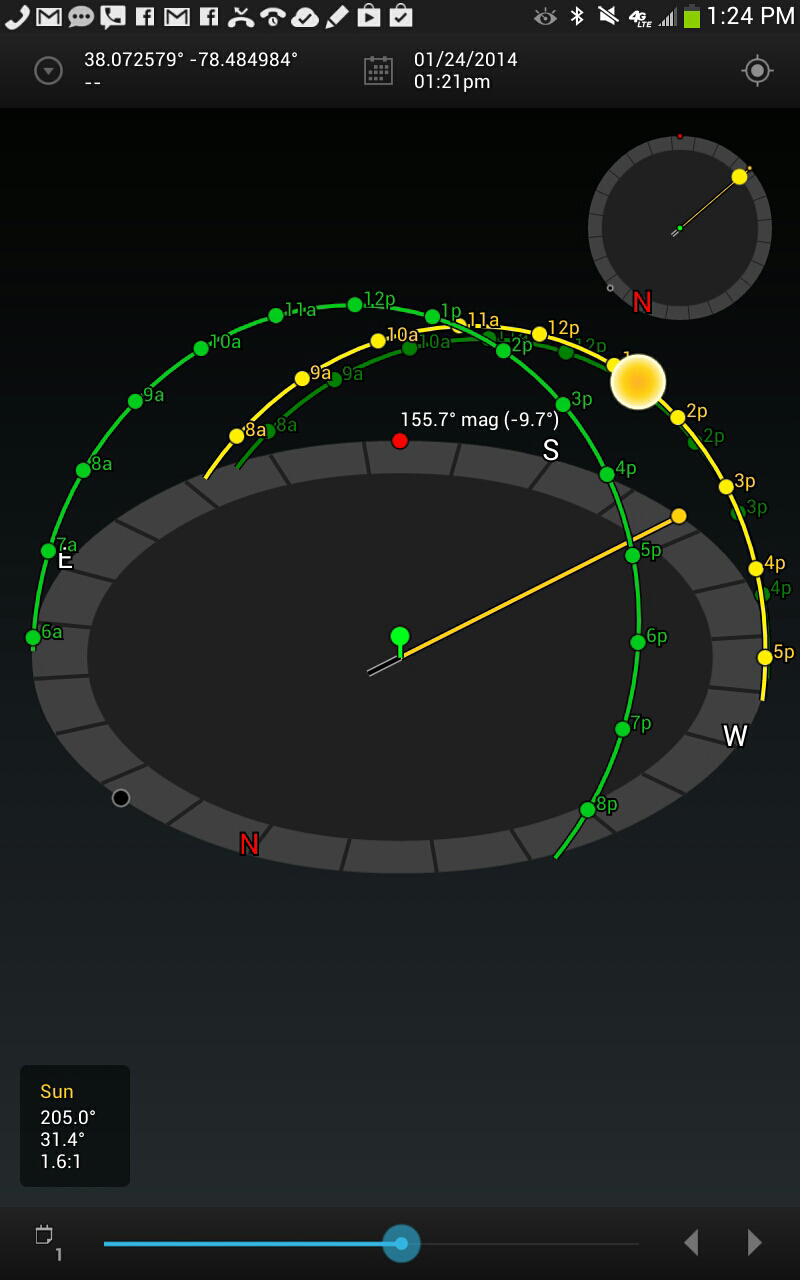
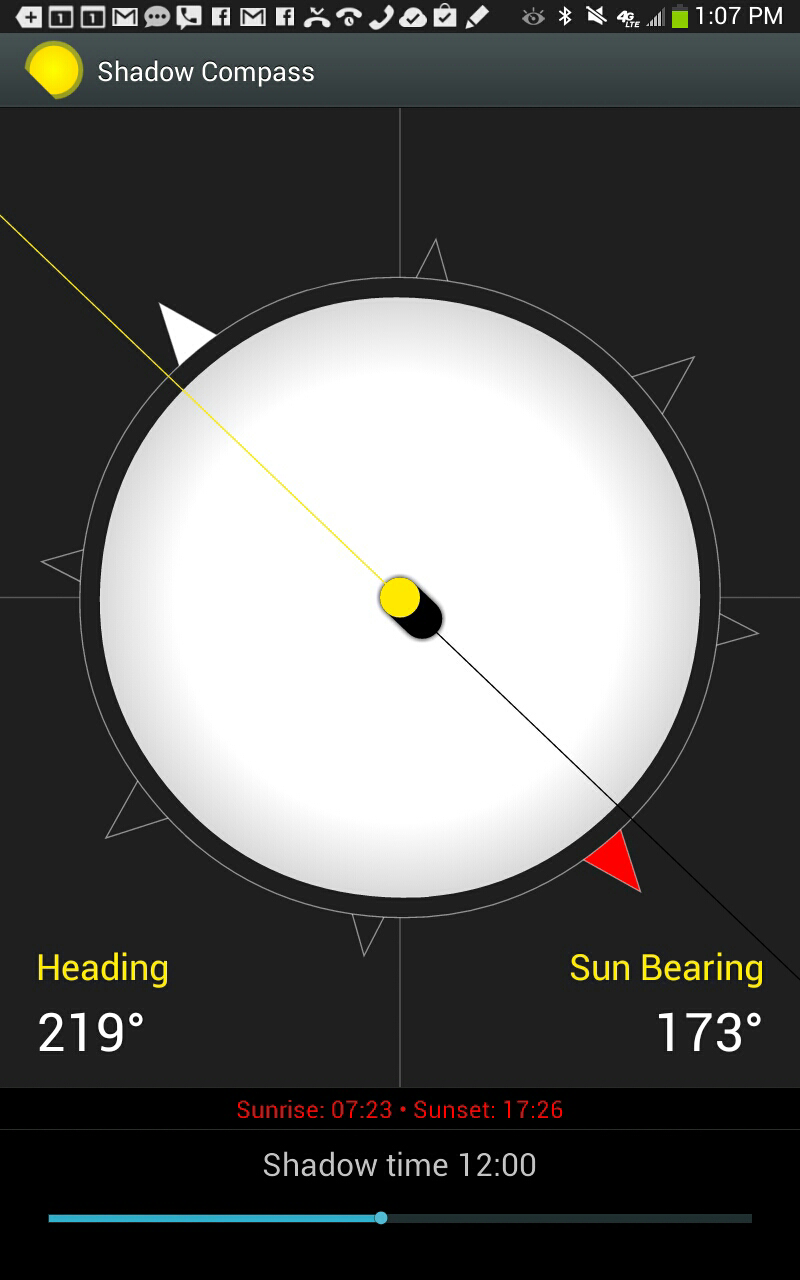
7. Doing the survey with the less expensive augmented reality apps SunPlan and Sun Surveyor is a similar process, but is more labor intensive. Use the app to take augmented reality screenshots to create a panorama on a computer later. I like to turn on the winter and summer solstice sun paths in the app because it gives a nice reference point when using them later. It’s a good idea to take a panorama even if you used the Solar Shading app to make the solar chart because it shows what the obstructions are. They are the most valuable together.


8. Turn the images into a panorama using a panorama maker program like Microsoft ICE. The augmented reality pieces confuse these programs pretty badly, so it’s not going to be flawless. Let me know if you find a way to get a cleaner panorama!

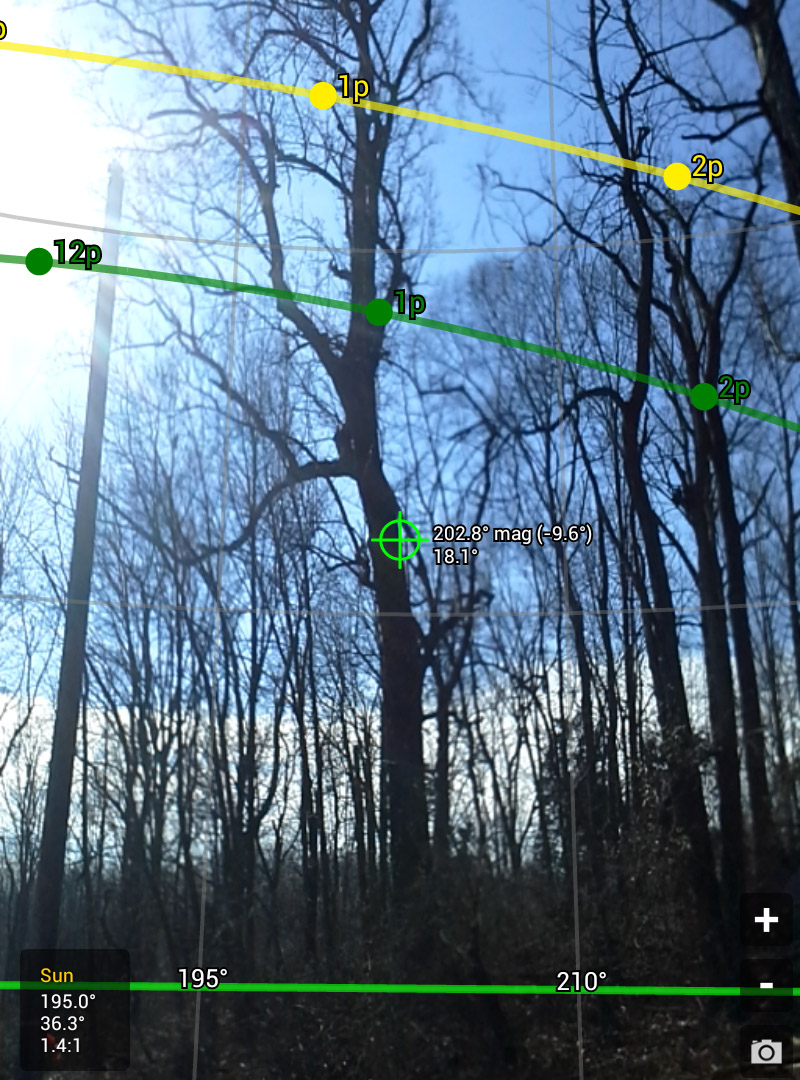
9. Download a clean solar chart online for the survey location from http://solardat.uoregon.edu/SunChartProgram.html
10. Open Photoshop, GIMP, or another image editor that allows the use of layers to open the chart made in step 9 side by side to the panorama made in step 8. On a new layer use the paintbrush and masks to make a clean horizon on the chart from step 9 using the panorama as a reference. On a new layer use the paintbrush and masks to make a clean “green” horizon on the same chart using the panorama as a reference. Put some text to let everyone know where in the world the survey was taken and you’re done.

 Tour the first Passive House in Virginia with the General Contractor and Owner as they explain the intentions going into the project and lessons learned. Lankford Passive House has three bedrooms, two-and-a-half bathrooms, and about 2,250 square feet.